
Study Material Development
Introduction to Statistics: Exam Review Sheet
This sample demonstrates: Concept grouping, formula interpretation, a worked confidence-interval example, retrieval-practice questions, common-error warnings, and a short study plan.
Prepared by Academic Wizard · Hypothetical portfolio demonstration
566-word excerpt
Study Material Development
Undergraduate Introductory Statistics
Course-Concept Review
Concept grouping, formula interpretation, a worked confidence-interval example, retrieval-practice questions, common-error warnings, and a short study plan.
Portfolio demonstration · Educational illustration. Hypothetical, non-client material created to demonstrate the review method. It is not a completed assignment for submission. Customer files and deliverables are never published.
Review proof
Brief, reasoning, and final quality control
Hypothetical statistics review sheet: organize concepts, formulas, worked examples, retrieval practice, and common-error warnings.
- Concept coverage
- Formula accuracy
- Worked-example logic
- Retrieval-practice usefulness
- Grouped material by learning objective instead of textbook order.
- Placed interpretation beside formulas to reduce mechanical memorization.
- Added retrieval questions and misconception checks so the guide supports active practice.
- Concepts match the supplied scope
- Worked arithmetic is checked
- Answers distinguish interpretation from calculation
- No exam answers or unauthorized assistance included
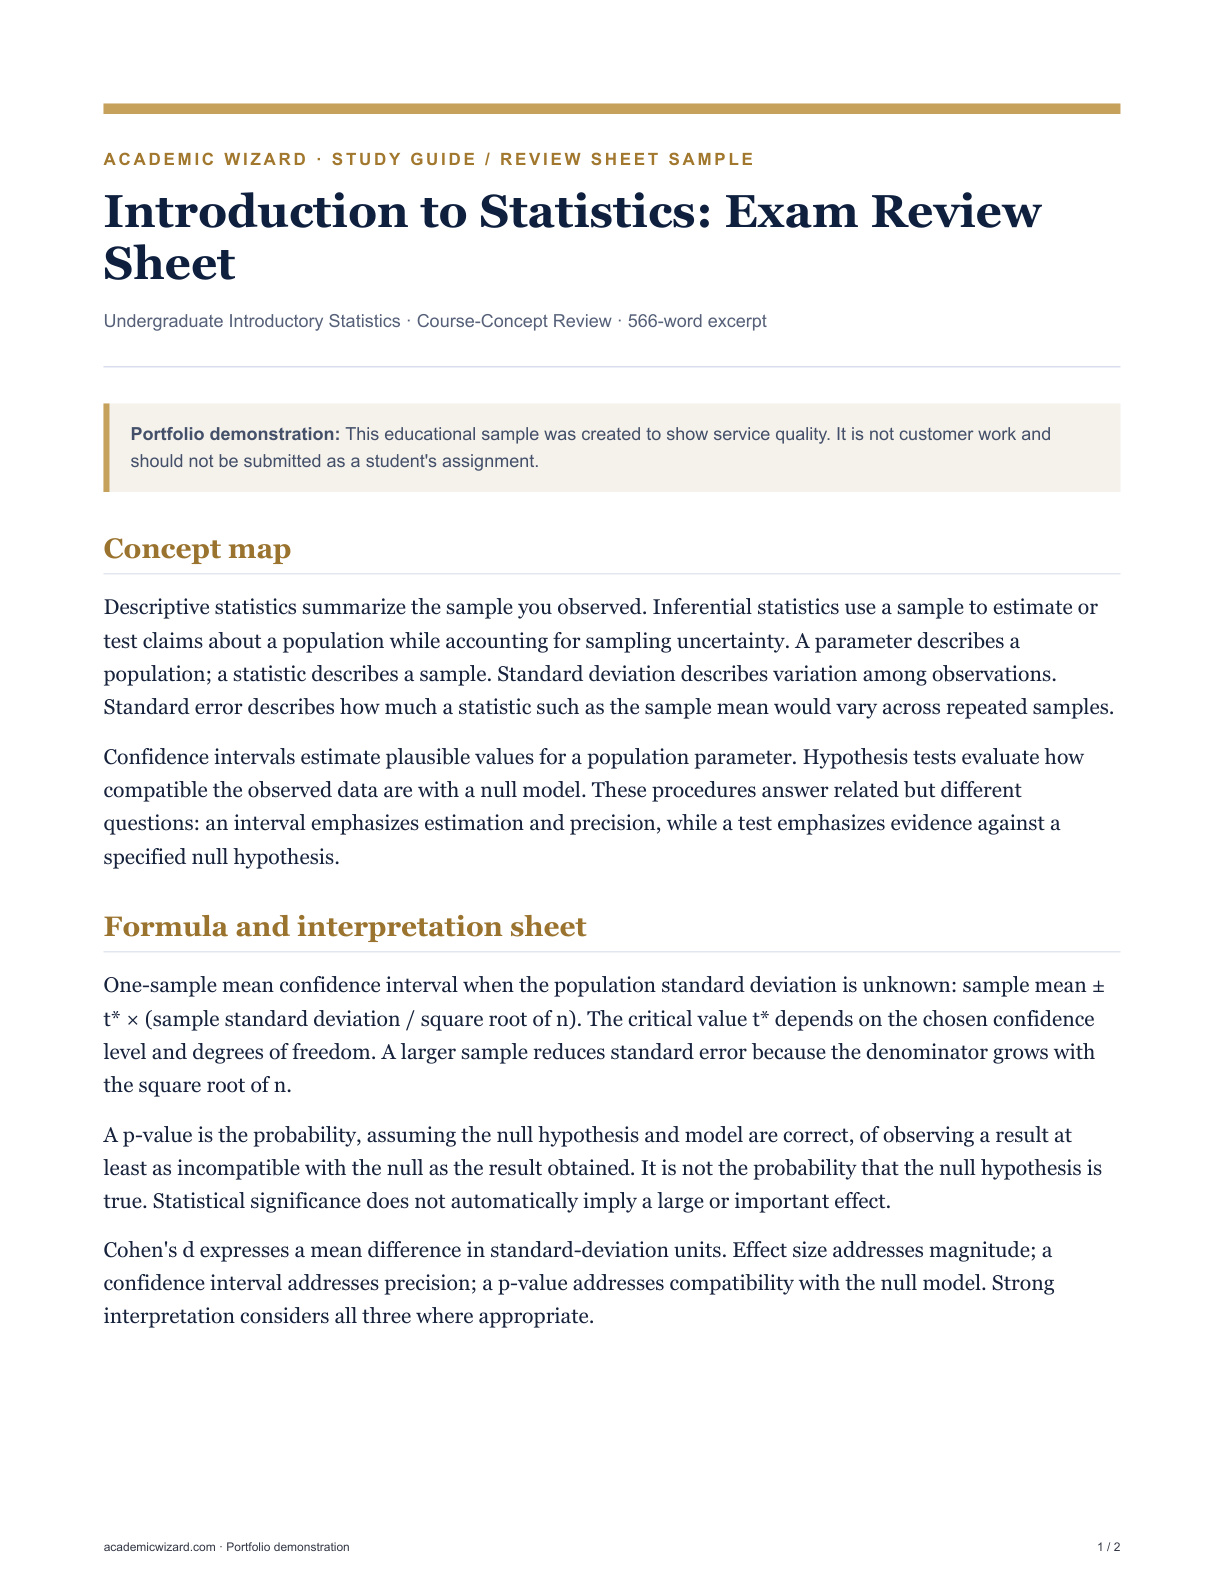
Concept map
Descriptive statistics summarize the sample you observed. Inferential statistics use a sample to estimate or test claims about a population while accounting for sampling uncertainty. A parameter describes a population; a statistic describes a sample. Standard deviation describes variation among observations. Standard error describes how much a statistic such as the sample mean would vary across repeated samples.
Confidence intervals estimate plausible values for a population parameter. Hypothesis tests evaluate how compatible the observed data are with a null model. These procedures answer related but different questions: an interval emphasizes estimation and precision, while a test emphasizes evidence against a specified null hypothesis.
Formula and interpretation sheet
One-sample mean confidence interval when the population standard deviation is unknown: sample mean ± t* × (sample standard deviation / square root of n). The critical value t* depends on the chosen confidence level and degrees of freedom. A larger sample reduces standard error because the denominator grows with the square root of n.
A p-value is the probability, assuming the null hypothesis and model are correct, of observing a result at least as incompatible with the null as the result obtained. It is not the probability that the null hypothesis is true. Statistical significance does not automatically imply a large or important effect.
Cohen's d expresses a mean difference in standard-deviation units. Effect size addresses magnitude; a confidence interval addresses precision; a p-value addresses compatibility with the null model. Strong interpretation considers all three where appropriate.
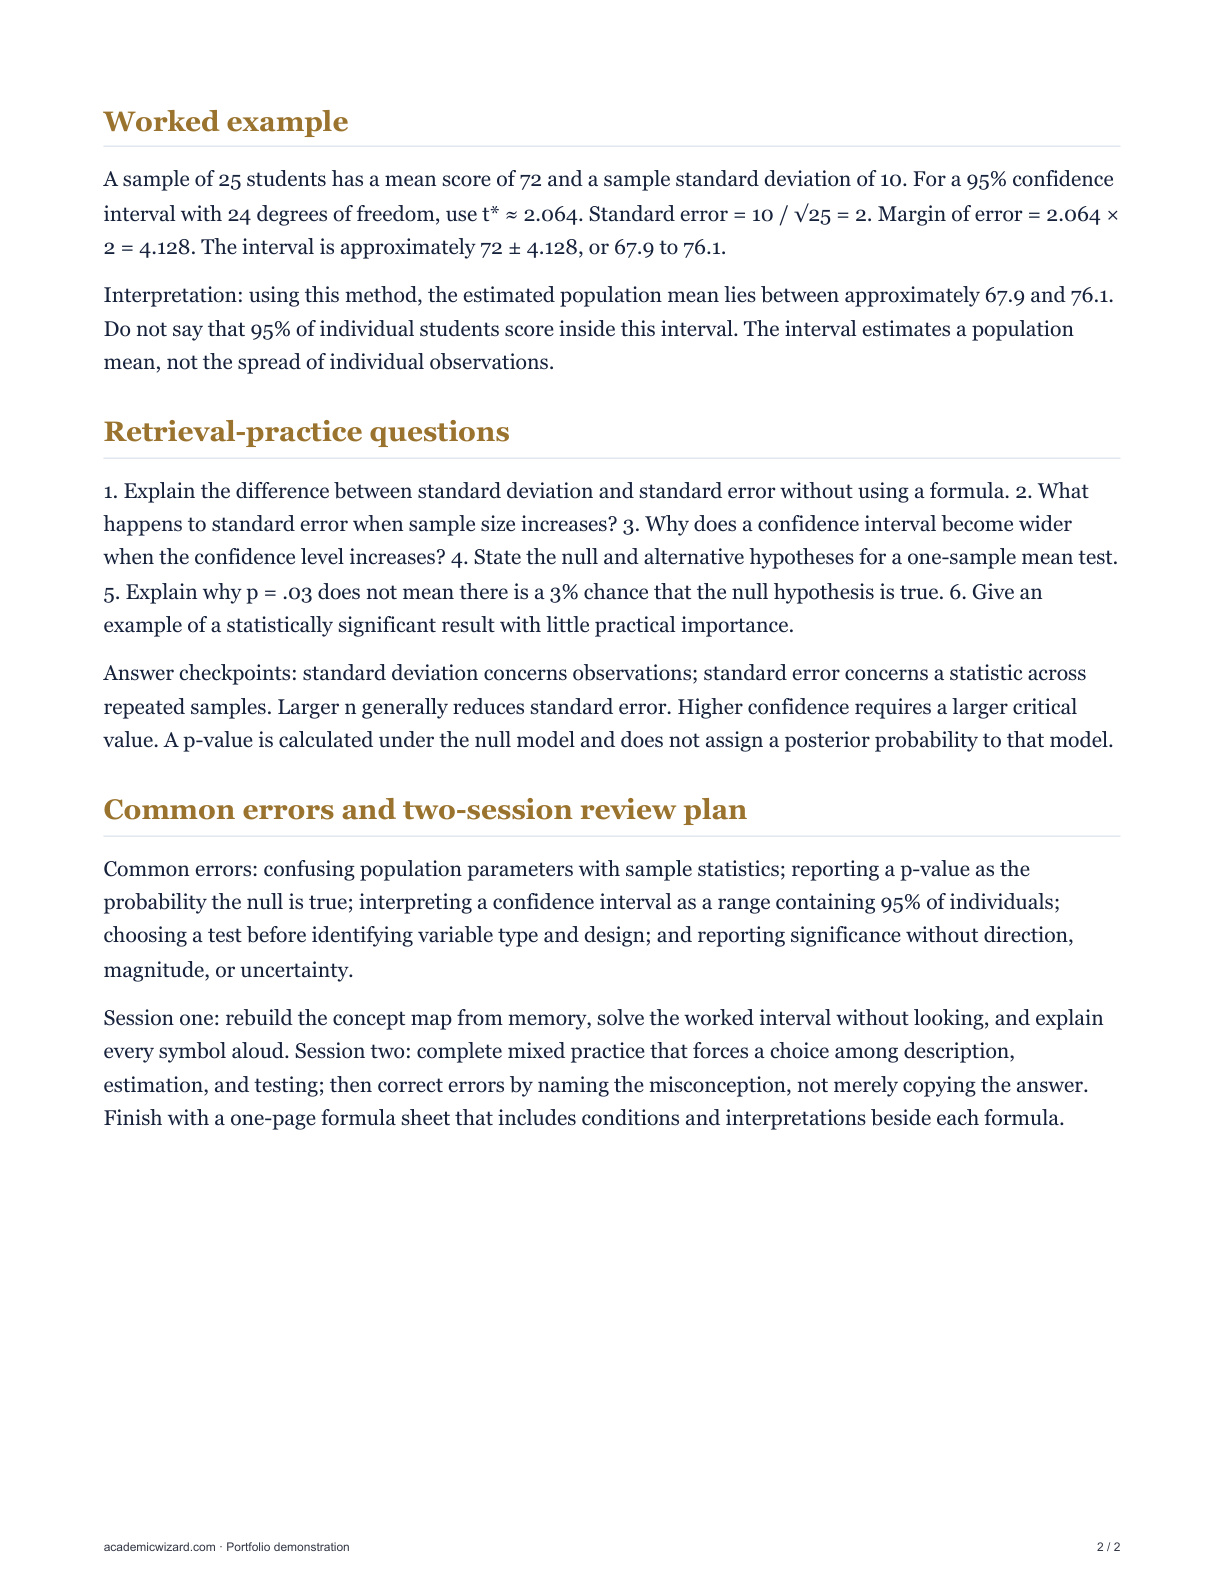
Worked example
A sample of 25 students has a mean score of 72 and a sample standard deviation of 10. For a 95% confidence interval with 24 degrees of freedom, use t* ≈ 2.064. Standard error = 10 / √25 = 2. Margin of error = 2.064 × 2 = 4.128. The interval is approximately 72 ± 4.128, or 67.9 to 76.1.
Interpretation: using this method, the estimated population mean lies between approximately 67.9 and 76.1. Do not say that 95% of individual students score inside this interval. The interval estimates a population mean, not the spread of individual observations.
Retrieval-practice questions
1. Explain the difference between standard deviation and standard error without using a formula. 2. What happens to standard error when sample size increases? 3. Why does a confidence interval become wider when the confidence level increases? 4. State the null and alternative hypotheses for a one-sample mean test. 5. Explain why p = .03 does not mean there is a 3% chance that the null hypothesis is true. 6. Give an example of a statistically significant result with little practical importance.
Answer checkpoints: standard deviation concerns observations; standard error concerns a statistic across repeated samples. Larger n generally reduces standard error. Higher confidence requires a larger critical value. A p-value is calculated under the null model and does not assign a posterior probability to that model.
Common errors and two-session review plan
Common errors: confusing population parameters with sample statistics; reporting a p-value as the probability the null is true; interpreting a confidence interval as a range containing 95% of individuals; choosing a test before identifying variable type and design; and reporting significance without direction, magnitude, or uncertainty.
Session one: rebuild the concept map from memory, solve the worked interval without looking, and explain every symbol aloud. Session two: complete mixed practice that forces a choice among description, estimation, and testing; then correct errors by naming the misconception, not merely copying the answer. Finish with a one-page formula sheet that includes conditions and interpretations beside each formula.
Get the Final QA Checklist
Use the same evidence-first review order demonstrated in Academic Wizard's public samples.
The requested resource is sent even if you leave optional marketing unchecked. Privacy Policy applies.
Sample questions
What this example is—and how to use it
What does this Study Material Development sample demonstrate?
Concept grouping, formula interpretation, a worked confidence-interval example, retrieval-practice questions, common-error warnings, and a short study plan.
Is this real student or client work?
No. Academic Wizard created this hypothetical portfolio sample to demonstrate a defined service while protecting student privacy and avoiding fabricated testimonials.
Can I submit this sample as my own work?
No. Use the sample to understand structure, review scope, and deliverable quality. Your submission must remain your own work and follow your institution's rules.
Keep learning
Related service, guide, and tools
More sample deliverables
Ready when you are
Get structured support on your next assignment
Choose the defined expert service that fits your student-authored work, or use the free Assignment Control Center for planning.
Want to compare every expert option? Browse Expert Help or view pricing